Production Decisions and Costs
How firms turn inputs into output — and what it costs them.
Every firm — a HEYTEA shop in Foshan, a BYD car factory in Shenzhen, a small restaurant near your school — must decide how much to produce and what it will cost. Before a firm can decide price, it must understand its own cost structure.
Costs split into two groups. Fixed costs stay the same no matter how much the firm makes. A HEYTEA shop pays the same rent whether it sells 10 cups or 500 cups per day. Variable costs rise when output rises — more cups means more tea leaves, more milk, more sugar, more labour hours.
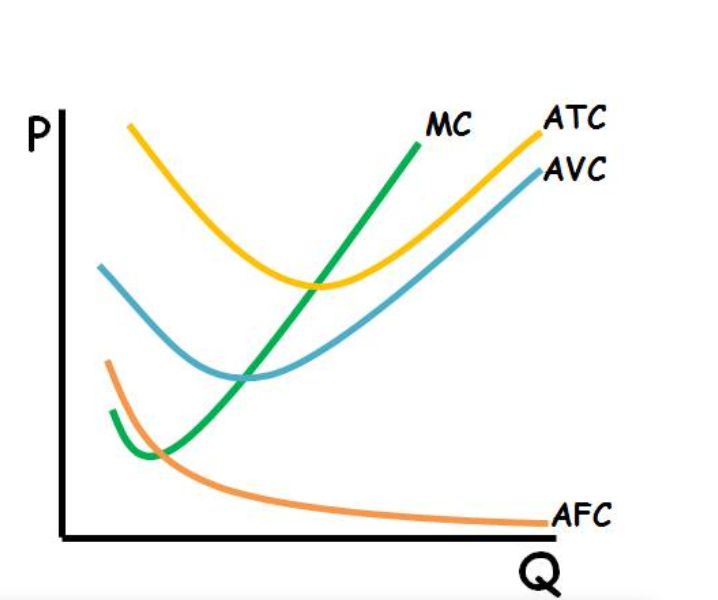
Average total cost is the cost per unit. If a factory spends ¥10,000 to make 500 pairs of shoes, ATC = ¥20 per pair. Marginal cost is the cost of producing just one more unit. If adding one more pair costs ¥15, MC = ¥15.
In the short run, firms may face diminishing marginal returns. If a small bubble-tea kitchen keeps its equipment fixed while hiring more workers, the kitchen eventually becomes crowded. After a point, each additional worker adds less extra output, so marginal cost tends to rise. This helps explain the upward-sloping portion of the typical MC curve; marginal cost does not necessarily rise at every level of output.
Economies of Scale — Why Bigger Firms Can Be Cheaper
In the long run, firms can change factory size. Larger firms often enjoy economies of scale — their average cost per unit falls as they produce more. There are several reasons this happens:
- Bulk-buying discounts. A large factory buying 10,000 kg of tea leaves pays a lower price per kg than a corner shop buying 50 kg. Suppliers reward big orders.
- Specialisation of labour. In a small kitchen, one worker does everything. In a BYD assembly line, each worker does one task repeatedly and becomes very fast and skilled. Output per worker rises, cost per unit falls.
- Better machinery. Expensive equipment (robotic arms, large ovens, automated bottle fillers) is only worth buying if you produce millions of units. Big firms can spread the fixed cost of this equipment over huge output.
- Spreading fixed costs. Rent, insurance, and head-office salaries stay roughly the same whether the factory makes 1,000 units or 100,000. More units means a smaller share of fixed costs attached to each unit.
- Financial advantages. Big firms borrow at lower interest rates and get better payment terms from suppliers.
All of these reasons pull the long-run ATC curve downward as output rises.
Diseconomies of Scale — Why Firms Can Get Too Big
Economies of scale do not last forever. If a firm keeps growing, average cost eventually starts to rise again. This is called diseconomies of scale. The main causes:
- Communication problems. In a company of 50 workers, everyone knows each other and decisions are fast. In a company of 50,000 workers across many provinces, a message from the top takes weeks to reach the factory floor — and may arrive garbled.
- Management complexity. Supervising thousands of workers requires layers of managers. These managers cost money and sometimes make conflicting decisions.
- Worker motivation. In a huge firm, employees can feel like a tiny part of a machine. Motivation falls, mistakes rise, costs go up.
- Coordination of supply chains. A single late shipment of batteries can halt an entire EV production line. The bigger the operation, the more things that can go wrong.
The result is a long-run ATC curve that is U-shaped: falling at first (economies of scale dominate), reaching a minimum (minimum efficient scale), then rising again (diseconomies of scale take over). Successful firms try to stay near the bottom of this U.
BYD reported selling about 3.02 million new-energy vehicles in 2023, a category that includes battery-electric and plug-in hybrid vehicles. Large-scale production can help firms spread fixed costs and negotiate lower input prices, although scale is only one of several factors behind China's EV industry growth.
Economies of scale explain why big firms often beat small ones on price. Diseconomies of scale explain why the biggest firms are not always the most efficient — and why some giant companies get broken up or restructured.
Perfect Competition in the Short and Long Run
Many small firms, identical products, no market power.
Perfect competition is a market model, not a description of the real world. It describes markets with many small firms selling identical products — the classic example is a farmers' market where dozens of stalls sell the same bok choy at the same price. Each seller is tiny, so no one can raise their price without losing all customers.
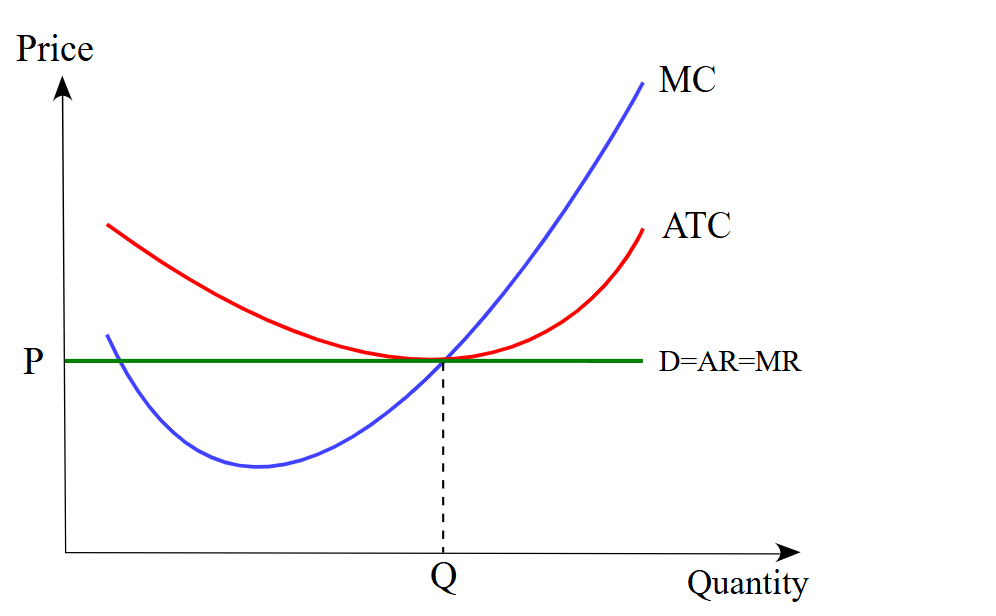
Because every firm must sell at the market price, each firm is a price taker. The demand curve facing one firm is a flat horizontal line at the market price. The firm's marginal revenue equals that price for every unit.
To maximize profit, the firm compares MR with MC. If MR > MC, make more (the next unit adds more revenue than cost). If MR < MC, make less. The best quantity is where MR = MC.
The Four Conditions for Perfect Competition
A market is only 'perfectly competitive' if all four of these conditions hold. Real markets rarely meet them all — but the model helps us understand what happens when competition is strong:
- Many small sellers. So many that no single firm can affect the market price by itself. Think of all the farmers growing cabbage in Guangdong — one farmer selling less has no effect on anyone.
- Identical products. Every seller offers exactly the same product. A grain of rice from Farmer Li is the same as a grain of rice from Farmer Wang. Buyers do not care which stall they buy from.
- Free entry and exit. New firms can start whenever they want; existing firms can shut down whenever they want. There are no legal barriers, no huge start-up costs, no secret knowledge required.
- Perfect information. Buyers and sellers know every price in the market. Nobody can trick anyone into paying too much.
When all four hold, no firm has any market power. Each must take the price the whole market produces.
Why the Firm Is a Price Taker
Imagine you are one bok-choy farmer among 5,000 others at a Guangzhou wholesale market. The market price today is ¥4 per kg. What happens if you try to raise your price?
- If you ask ¥5, buyers simply walk 10 metres to the next stall and pay ¥4. You sell zero kg.
- If you ask ¥3, you lose money for no reason — buyers were already willing to pay ¥4, so you earn ¥1 less per kg than you could.
- The only sensible choice is to accept the market price of ¥4 and decide how many kg to produce.
That is what 'price taker' means. The firm has power over quantity (how much to grow) but no power over price.
Short-Run Outcomes — Four Possibilities
In the short run — before new firms can enter or old ones exit — a perfectly competitive firm can be in one of four situations, depending on where the market price sits relative to its ATC and AVC curves:
- Economic profit. Market price is above ATC. The firm earns more than normal profit — a profit rectangle (P − ATC) × Q appears on the graph. This is a short-term bonus.
- Break-even. At the profit-maximising output, market price equals ATC (P = ATC). The firm covers every cost, including the opportunity cost of the owner's resources, and earns zero economic profit (normal profit). In long-run equilibrium under the standard model, price equals minimum ATC.
- Operating at a loss but still producing. Market price is below ATC but above AVC. The firm cannot cover all costs, but each sale still covers variable cost and helps pay some of the fixed cost. Better to keep producing than to shut down.
- Shutdown. Market price falls below AVC. Each sale loses money even on variable costs. The firm stops producing immediately, cuts variable costs to zero, and absorbs only the fixed costs.
The shutdown rule is a key short-run decision. Shutting down does not mean closing the firm forever — it means stopping production temporarily until the market price recovers.
How the Long Run Erases Profit and Loss
The long run is a period long enough for firms to enter or leave the industry. Free entry and exit are what drive the market toward long-run equilibrium:
- If firms are earning economic profit, outsiders see the profit and enter the market. More sellers means market supply rises, which pushes price down. New firms keep entering until economic profit disappears and only normal profit remains.
- If firms are losing money, some owners give up and exit the industry. Fewer sellers means market supply falls, which pushes price up. Firms keep exiting until losses disappear and remaining firms break even.
- In the standard long-run equilibrium model with identical firms and free entry and exit: P = MR = MC = minimum ATC. Firms earn normal profit, so there is no incentive for entry or exit.
This outcome is both productively efficient (produced at lowest ATC — no waste) and allocatively efficient (price equals marginal cost — exactly as much is produced as society values).
Pure perfect competition is rare, but online marketplaces like Taobao for simple commodities (plain T-shirts, USB cables) come close — thousands of tiny sellers, nearly identical products, prices race to the floor.
The long-run outcome of perfect competition — zero economic profit — is not bad. It means resources are used efficiently and consumers get the lowest possible price for the given technology.
Monopoly: Pricing, Output, and Welfare Effects
One seller, high barriers, and the cost to society.
A monopoly exists when one firm controls the entire market. In China, China Tobacco is a state monopoly — by law, it is the only legal producer and seller of cigarettes. State Grid Corporation is a near-monopoly in electricity distribution. These firms face no direct competitors.
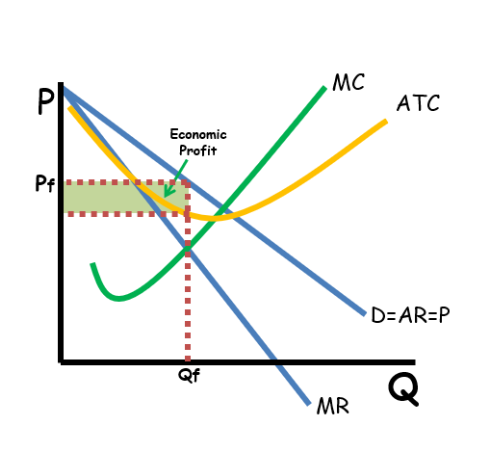
Because a monopoly is the only seller, its demand curve is the entire market demand curve — downward sloping. To sell more units, it must lower the price.
Where Monopolies Come From — The Four Main Barriers to Entry
A firm does not become a monopoly by accident. Something must stop other firms from entering the market and competing. Economists group these barriers into four main types:
- Legal barriers. The government gives one firm the legal right to be the only seller. Patents protect inventors (a drug company gets 20 years alone to sell a new medicine). Licences restrict who can operate (China Tobacco has an exclusive licence). Copyrights protect books, music, and films.
- Natural barriers. In some industries, one large firm serves the whole market more cheaply than many smaller firms could. Water pipes, electricity grids, and subway systems are examples. Building two parallel water networks under one city would waste money. These are called natural monopolies.
- Control of a key resource. If one firm owns the only supply of an essential raw material, it blocks competitors. De Beers once controlled most of the world's diamond mines. A firm with the only mine of a rare metal needed for smartphone screens would be a near-monopoly.
- High start-up costs. Some industries need enormous investment before producing one unit. Building a new high-speed rail system or a new mobile phone network costs tens of billions of RMB. Most firms simply cannot afford to enter.
Without barriers to entry, any monopoly profit would attract new firms and the monopoly would disappear.
Why Marginal Revenue Is Less Than Price — A Step-by-Step Example
For a monopoly, MR is always below the price it charges. Here is why, with simple numbers:
- Suppose the monopoly sells 10 units at ¥100 each. Total revenue = 10 × ¥100 = ¥1,000.
- To sell an 11th unit, the firm must lower the price to ¥95. But it must drop the price on all 11 units, not just the extra one. So price falls on the 10 units it was already selling too.
- New total revenue = 11 × ¥95 = ¥1,045.
- Marginal revenue (extra revenue from the 11th unit) = ¥1,045 − ¥1,000 = ¥45.
- The price is ¥95 but marginal revenue is only ¥45. MR is far below P.
This is why a monopoly's MR curve lies below its demand curve — and why the firm produces less than it would if P = MR (as in perfect competition).
The Cost to Society — Deadweight Loss, Explained Simply
A monopoly still produces where MR = MC — but because MR is below P, the quantity it produces is less than the socially efficient level. Society loses value. This lost value is called deadweight loss (DWL):
- Consumers lose. Some people would happily pay more than the cost of making the product, but less than the monopoly price. They do not buy. Their satisfaction is lost — not transferred, just gone.
- The firm earns high profit, but this is a transfer from consumers to the firm, not new wealth created. Those extra RMB come out of consumers' pockets.
- The economy produces fewer units than it should. Workers and resources that would be used making the extra units go elsewhere — possibly to less valuable uses.
On the graph, DWL is a triangle between the monopoly quantity and the socially efficient quantity, bounded above by the demand curve and below by the MC curve. The size of the triangle measures the total value society loses to monopoly power.
Price Discrimination — Different Prices for Different People
Monopolies can sometimes charge different prices to different buyers for the same product. This is price discrimination. Three conditions must hold:
- The firm must have market power (be a monopoly or near-monopoly).
- Buyers must have different willingness to pay — students vs. business travellers, say.
- The firm must be able to prevent resale — the student with the cheap ticket cannot resell it to a business traveller.
Examples: Chinese high-speed rail offers student and senior discounts; airlines charge last-minute business passengers much more than tourists who book early; cinemas charge adults more than children. Price discrimination transfers some surplus from consumers to the firm — but it can also raise total output (more people can afford the product at the lower price), sometimes reducing deadweight loss.
China's state tobacco monopoly is an unusually large state-owned business and a major source of public revenue. A 2026 report estimated that its profit and tax contributions in 2025 were about 7% of China's central-government revenue. The percentage depends on the year and the definition of government revenue, so it should not be treated as a fixed annual figure.
Monopolies are not always bad. Natural monopolies (water, electricity) can be cheaper than competition. The problem is high price, restricted output, and the lack of pressure to innovate or control costs.
Oligopoly
A few large firms watching each other closely.
An oligopoly is a market dominated by a few large firms. In China, three state-owned telecom companies — China Mobile, China Unicom, and China Telecom — share the mobile phone market. Globally, Boeing and Airbus dominate large aircraft. The high-speed rail industry, large car manufacturing, and global oil are also oligopolies.
What Makes a Market an Oligopoly
Not every market with 'a few' firms counts as oligopoly. Economists look for a mix of these features:
- Few large firms. Usually 2 to 10 firms produce most of the market's output. One firm alone would be a monopoly; many small firms would be perfect or monopolistic competition.
- High barriers to entry. New firms struggle to enter. The barriers may be huge start-up costs (building an aircraft factory), government licences (telecom spectrum), or strong brand loyalty built over decades.
- Products may be identical or differentiated. Oil is almost identical across sellers; cars and mobile networks are heavily branded. Both still count as oligopoly if a few firms dominate.
- Interdependence. This is the defining feature. Each firm is big enough that its decisions change the market for every rival. One firm cutting price forces every other firm to respond.
Classical examples: global passenger aircraft (Boeing, Airbus), smartphone chips (TSMC, Samsung, Intel), Chinese e-commerce (Alibaba, JD, Pinduoduo), global soft drinks (Coca-Cola, PepsiCo).
Interdependence — Why Oligopolists Watch Each Other Constantly
In perfect competition, a firm just checks the market price and ignores other firms — each is too small to matter. In monopoly, there are no rivals to watch. Oligopoly is different: every big decision depends on what rivals will do.
- Pricing. If China Mobile cuts its 5G data plan by 20%, millions of Unicom and Telecom customers may switch. Unicom and Telecom will almost certainly match the cut — so China Mobile may lose profit without stealing any customers.
- New products. When Alibaba launched Taobao Live, JD and Pinduoduo had to add live-streaming shopping within months. One firm's innovation becomes every firm's problem.
- Advertising. If one soft-drink maker spends more on advertising, rivals must spend more too — or lose market share. Advertising spending in oligopoly markets is enormous.
- Capacity decisions. Building a new factory is risky. If three car makers each build new factories at the same time, the market may be flooded and nobody earns back the investment.
Every big move must be analysed through the question: what will our rivals do in response?
Collusion — Why Firms Are Tempted and Why It Often Breaks Down
If oligopolists cooperate instead of competing, every firm earns more. This temptation to cooperate is called collusion. It can take several forms:
- Formal cartels. A group of firms openly agrees to fix prices or restrict output. OPEC (the Organisation of the Petroleum Exporting Countries) is the most famous example — member countries agree on oil production quotas to raise world prices.
- Secret price-fixing. Firms meet in private to agree on prices. This is illegal in most countries and is punished with huge fines when discovered.
- Tacit collusion. Firms do not meet or communicate, but each understands that cutting price will trigger a price war. All firms quietly keep prices high. This is harder to prosecute because there is no explicit agreement.
- Price leadership. One firm (usually the biggest) sets a price and others follow. No agreement is needed — just a signal.
Collusion breaks down for a simple reason: each firm has an incentive to cheat. If every other firm keeps the price high and you secretly lower yours a little, customers rush to you and your profit jumps. But when every firm thinks this way, several cheat at once, and the agreement collapses. This is the prisoner's dilemma applied to business.
The Kinked Demand Curve — Why Oligopoly Prices Are Sticky
One of the puzzles of oligopoly markets is that prices often stay the same for long periods, even when costs change. The kinked demand curve model explains why:
- If one firm raises its price, rivals do not follow — they are happy to steal its customers. The firm loses lots of sales. Above the current price, demand is highly elastic.
- If one firm cuts its price, rivals immediately match — they cannot afford to lose customers. Nobody gains market share, but everybody earns less. Below the current price, demand is relatively inelastic.
- The result is a 'kink' at the current price. The firm's demand curve is almost flat above the kink and much steeper below it.
- Both moves hurt the firm. So the firm leaves the price alone — and competes instead on advertising, product features, service, or loyalty programs (non-price competition).
Game Theory and the Prisoner's Dilemma — The Oligopolist's Trap
Game theory is a tool for thinking about choices where your result depends on what someone else chooses. The classic story is the prisoner's dilemma. Here is a business version:
- Two airlines compete on the Guangzhou–Shanghai route. Each must choose: keep ticket prices high, or cut them to steal customers.
- If both keep prices high, each earns ¥80 million. If both cut prices, each earns only ¥40 million. If one cheats (cuts price while the other stays high), the cheater earns ¥120 million and the loyal firm earns only ¥10 million.
- For each firm, cutting price is the best move no matter what the rival does. So both cut, and both earn ¥40 million — much less than the ¥80 million they could have earned by cooperating.
- The lesson: individual rational choices lead to a group-level bad outcome. This is why oligopolists keep trying (and failing) to cooperate.
China's three telecom giants rarely compete on headline prices. Instead, they compete through data bundles, free streaming subscriptions, and 5G coverage. Classic non-price competition in an oligopoly.
Oligopoly behaviour depends heavily on whether firms trust each other. Where trust is high, informal collusion sustains high prices. Where it breaks down, price wars erupt and consumers benefit — briefly.
Monopolistic Competition
Many sellers, similar products, a small amount of market power from branding.
Monopolistic competition describes markets with many firms selling similar but differentiated products. Think of the milk-tea market in Guangzhou — HEYTEA, Nayuki, Yi Dian Dian, CHAGEE, Mixue, and dozens of smaller brands. All sell bubble tea. Each has its own menu, design, pricing, and image. Customers can taste the difference and have preferences, but no single brand can control the market.
How Firms Differentiate Their Products — The Branding Toolkit
The key feature of monopolistic competition is product differentiation. Firms work hard to make their product seem different, even when the basic product is similar. The main tools:
- Physical differences. Different flavours, ingredients, portion sizes, or packaging. HEYTEA built its brand on fresh cheese foam toppings. Nayuki added fresh fruit chunks to its drinks. Even a small change creates a 'different' product in consumers' minds.
- Branding and image. The logo, store colours, name, and story. Mixue uses a bright red snowman mascot and sells cheap, friendly, mass-market drinks. HEYTEA uses minimalist black-and-white design and targets trendy young urban customers. Same category, different image.
- Location. A milk-tea shop next to a school captures the student lunch crowd; one in a shopping mall captures tourists. Location is itself a form of differentiation.
- Quality and service. Cleaner stores, friendlier staff, faster delivery through Meituan, premium ingredients. Customers notice.
- Advertising. Billboards, celebrity endorsements, Douyin ads, limited-edition promotions. Advertising shapes how consumers 'feel' about a brand, even when the drink itself is similar.
The goal of all this effort: give each firm a small amount of market power — a loyal following willing to pay a little more or walk a little further for its product.
Short-Run Profit, Long-Run Normal Profit — Why?
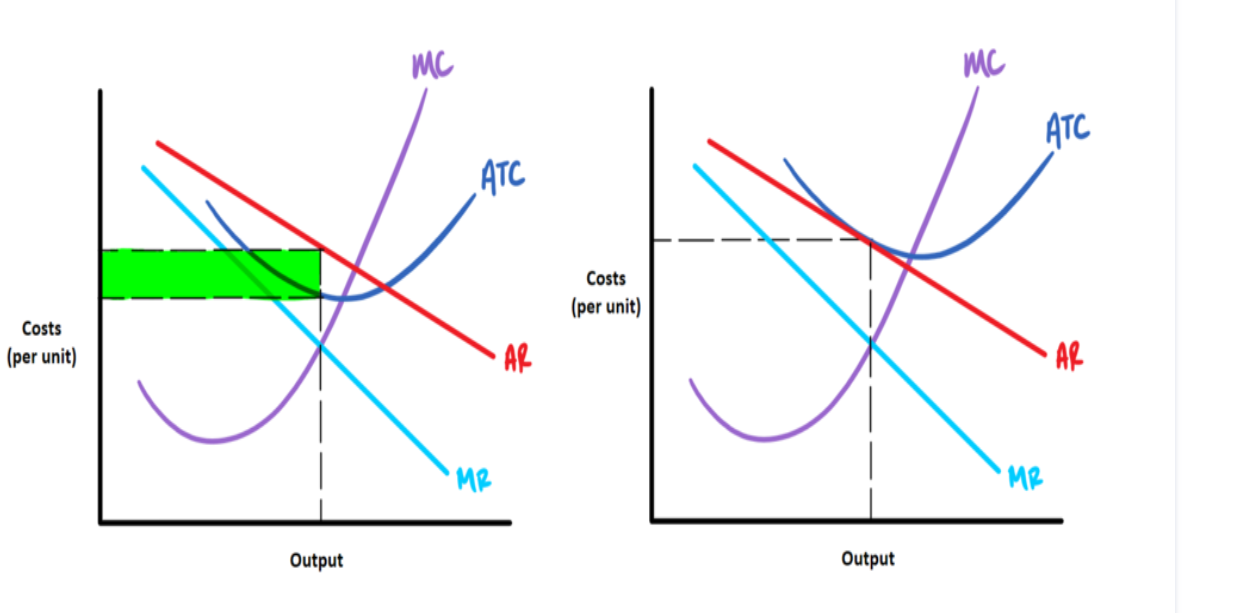
Monopolistic competitors face a downward-sloping demand curve (because they have some brand loyalty) but there is free entry into the market (because start-up costs are low — opening a bubble-tea shop is easy). This produces a two-stage story:
- Short run. A new popular brand (say HEYTEA when it first opened in a city) earns high economic profit. Customers love the product, the firm charges a high price, and ATC is well below price.
- Entry begins. Other entrepreneurs see the profit and open competing brands. Dozens of new milk-tea shops open on nearby streets, each with slightly different flavours.
- Demand curve shifts left. Each existing firm loses some customers to the new rivals. The demand curve each firm faces shifts to the left — fewer customers at every price.
- Entry continues until profit disappears. Firms keep entering as long as there is economic profit to be earned. In the long run, each firm's demand curve has shifted left just enough that it is tangent to the ATC curve — the firm earns only normal profit.
- Price still above MC. Even in long-run equilibrium, price stays above marginal cost (unlike perfect competition). This is the cost of product differentiation.
The entry story is why your city sometimes seems to have 'too many' milk-tea shops. Each shop earns only enough to cover costs, including a reasonable return to the owner — but no more.
Variety vs. Efficiency — The Trade-Off
Compared to perfect competition, monopolistic competition is slightly less efficient — but it gives consumers something perfect competition cannot:
- Consumers get variety. Many flavours, styles, store experiences, and new products every season. In perfect competition, every seller offers the same thing.
- Firms produce below the minimum of ATC. Each shop is a little too small to reach its lowest possible average cost — excess capacity. In practical terms, your local milk-tea shop could serve more customers without buying more equipment.
- Advertising creates costs. Firms spend money on branding and promotion that would not exist in perfect competition. Consumers pay a little more to cover these costs.
- Allocative inefficiency. Because price > MC, slightly less is produced than society would value.
Is this trade-off worth it? Most people say yes — the variety is worth the small loss of efficiency. If every café sold identical coffee at the lowest possible price, your choices would be dull. Monopolistic competition is the economic model behind the richness of modern consumer life.
One industry estimate reported that China's "new-style tea drinks" market reached RMB 333.4 billion in 2023; the category is broader than milk tea alone. The same report estimated about 515,000 new-style tea outlets by the end of August 2023. These figures vary by source and by how the market is defined. The many brands, differentiated menus, and advertising make this a useful example of monopolistic competition.
Advertising is the signature behaviour of monopolistic competition. Firms cannot win by cutting price (rivals copy); they win by making customers believe their product is unique. Variety is the gift to consumers; waste from excess advertising is the cost.
Government Intervention: Taxes, Subsidies, and Regulation
The policy toolkit for fixing market failure.
When markets fail, governments have several tools to improve outcomes. The main tools covered in BC Economics 12 are taxes, subsidies, regulation, direct provision, and price controls. Each one works best in different situations.
Taxes — How They Work and Who Really Pays
A tax is a payment firms or consumers must make to the government. An excise tax is a per-unit tax on a specific good — ¥5 per pack of cigarettes, ¥1 per litre of petrol. Here is how an excise tax affects a market:
- The tax raises the cost of producing each unit. The supply curve shifts up by the amount of the tax.
- The new equilibrium has a higher price for buyers, a lower price received by sellers (after they pay the tax), and a smaller quantity traded.
- Government collects revenue equal to the tax per unit × the new quantity sold.
- A deadweight-loss triangle appears — some trades that would have happened without the tax no longer do, and the value of those trades is lost.
Who really pays — tax incidence — depends on elasticities, not on which side of the market legally hands the money to the government. The legal responsibility for remitting the tax does not determine the economic burden. The side with the more inelastic curve bears more of the burden:
- If demand is more inelastic than supply (addictive goods like cigarettes), buyers absorb most of the tax through a higher price.
- If supply is more inelastic than demand (fresh fish, which must be sold today), sellers absorb most of the tax through a lower received price.
- If elasticities are similar, the burden is shared roughly equally.
A Pigouvian tax is designed to reflect the marginal external cost of a negative externality (such as pollution, second-hand smoke, or traffic congestion) at the socially efficient quantity. If set appropriately, it can move the market toward that quantity and reduce the deadweight loss caused by the externality; the tax itself is not automatically free of unintended effects.
Subsidies — Encouraging Good Behaviour
A subsidy is the opposite of a tax: the government pays firms or consumers to encourage production or consumption of a particular good. The main uses:
- Correcting positive externalities. Vaccines, education, and renewable energy produce benefits that spill over to society. A subsidy makes buyers see those extra benefits in the form of a lower price, so they consume more.
- Supporting infant industries. China supported the development and adoption of electric vehicles through purchase subsidies and other policy measures. In some early programmes, eligible battery-electric cars could receive subsidies of up to RMB 60,000 per vehicle; the maximum amounts were reduced over time, and the national purchase-subsidy programme ended in 2022. Such support may help an industry expand, but it is not the only explanation for its later success.
- Helping low-income groups. Food subsidies, housing subsidies, and transport subsidies all aim to make essential goods affordable.
- Protecting strategic sectors. Agriculture subsidies in many countries ensure a reliable domestic food supply, even if imports would be cheaper.
Subsidies have costs too. They are paid out of tax revenue, so taxpayers ultimately fund them. They can distort markets — if the subsidy is too high, firms produce more than society really needs. And they can be hard to remove once politicians, firms, and voters get used to them.
In January 2022, China's government reported that nearly RMB 150 billion had been provided in subsidies for new-energy vehicles since 2009. Separately, the International Energy Agency reported that China accounted for almost two-thirds of global electric-car sales in 2024. These facts show the scale of the policy effort and the market, but they do not prove that subsidies alone caused China's position; competition, battery supply chains, manufacturing scale, prices, and other policies also matter.
There is no single best tool. Pollution from power stations may be best handled by a Pigouvian tax. Air safety is handled by regulation, not a tax. Primary education is best directly provided. Policymakers match the tool to the problem.
Regulation — Setting Rules Instead of Prices
Instead of changing prices with a tax or subsidy, the government can simply set rules. This is regulation. Examples:
- Emission limits. Factories must keep air pollution below a legal cap.
- Safety standards. Children's toys must pass safety tests; restaurants must pass food-hygiene inspections.
- Licensing. Only trained and licensed people can drive taxis, perform surgery, or build bridges.
- Advertising rules. Cigarette advertising is banned in many countries. Medicine ads must list side effects.
- Working conditions. Minimum workplace safety, maximum working hours, child-labour bans.
When is regulation better than a tax? When the external cost is extremely dangerous (airline safety — one accident kills hundreds), when measuring the exact harm is hard, or when a hard limit is easier to enforce than a precise charge. But regulation can be rigid and expensive to monitor, and firms may lobby hard to weaken it.
Direct Provision and Price Controls — Two More Tools
Sometimes the market cannot provide a good at all, so the government produces it directly. In other situations, the government leaves the market in place but caps or floors the price.
- Direct provision. The government produces and funds the good itself, using tax revenue. Examples: public primary schools, national defence, basic road networks, public parks, the police force. These are usually goods where excluding non-payers is impossible (public goods) or where fair access is a social priority.
- Price ceilings (maximum prices). The government sets a legal maximum price below the free-market level. Example: rent control in some cities. Short-run winners: current renters. Long-run losers: future renters, because landlords stop building. Shortages and waiting lists are common.
- Price floors (minimum prices). The government sets a legal minimum price above the equilibrium level. A minimum wage is a price floor in the labour market. In the basic competitive model, a binding minimum wage can create a surplus of labour (unemployment): some workers who keep jobs earn more, while some may find it harder to find work. The actual effect depends on labour-market conditions and the size of the wage increase.
All intervention tools have costs. Taxes create deadweight loss on normal goods; subsidies cost taxpayers money; regulation can slow innovation; direct provision can be inefficient; price controls can cause shortages or unemployment. Good policy weighs the gain from fixing a market failure against the cost of the intervention itself. No single tool is always best — the right choice depends on the problem.